- Home
- Automotive & Transportation
-
Light Electric Vehicles Market
Light Electric Vehicles (LEVs) Market Size, Share, Growth Opportunity Analysis Report by Vehicle Type (Electric Two-wheelers, E-Rickshaws, Electric L5 Vehicles (E-3W), L6e Vehicles, and L7e Vehicles), Vehicle Category, Motor Capacity, Battery Capacity, Max Speed, GVWR (KG), Range, Pricing (USD), End-use Application, and Geography (North America, Europe, Asia Pacific, Middle East, Africa, and South America) - Global Industry Data, Trends - Forecast 2025‒2035
Industry : Automotive & Transportation | Pages : 180 Pages | Published On : Apr 2025

According to the Pranav Dandekar, CEO and co-founder of Wings EV, India’s first electric microcar (L7 vehicles) manufacturer quoted:
“Wings EV, an Indore-based firm, will unveil Robin, a two-seater EV, in Bengaluru in April 2025 to boost “personal commuting with zero pollution, less congestion and less road space”.
Light Electric Vehicles (LEVs) Market Size, Share, and Growth
The rapid growth for LEVs is attributed to the expansion by key players in the new market and geography.
The LEVs saw substantial growth and this was attributed to the advancement in technology, promoting policies that ushered the world into a new level in sustainable transport. Reduced operating costs and zero emission levels are the main driving forces behind consumer demand for LEVs.
Following the current mobility trends, it is expected that, in the near future, automated vehicle technologies-heavily integrated with sensors-will be part of an LEV landscape. Industry organizations such as the Light Electric Vehicle Association (LEVA) and the International Transport Forum (ITF) have emphasized the role of LEVs in the reduction of urban congestion and improvement to air quality.
LEVA-EU is urging European Commission to speed up the EU regulation for Light Electric Vehicles, to break through legal bottlenecks holding back the growth of the LEV sector, emphasizing to cover all LEVs currently under Regulation (EU) 168/2013 and the Machinery Directive/Regulation, also to facilitate the harmonization of standards and provide legal certainty for companies, helping to drive innovation. Big growth is in store for the industry, especially with the construction of charging infrastructure and declining prices of batteries, paving way for LEVs to become a stronghold in the future of sustainable transport.
Light Electric Vehicles (LEVs) Market Dynamics and Trends
Driver: Advancements in Battery Technology Leading to Enhanced Performance and Affordability
- In the last decade, the continuous advancement in the energy density of EV cells measured by weight (Wh/kg, crucial factor for maximizing driving range) has forged an increase of about 30%, whereas battery packs improved by 60%.
- Researchers are actively working on improving energy density through advancements in battery chemistry, materials, and manufacturing processes, currently around 260-270 Wh/kg for lithium-ion batteries, with ongoing research aiming to push up to 350 Wh/kg or higher.
- In 2023, the distributed demand for battery was accounted for 750 GW for the electric vehicles globally, representing 40% growth from the previous year, concluding to a significant growth in the uptake of LEVs.
- IEA reported such advancement are necessary to meet the future the energy demand by the transportation sector. These developments not only enhance performance but also reducing costs of EVs to bring some affordability for the consumers, especially in 2W/3W sector where affordability is key factor.
- The World Economic Forum also believes that advancements such as solid-state batteries and fast charging will accelerate broad adoption. With rising price and performance, urban mobility will soon witness the impact of LEV mainstreaming, while also injecting global environmental efforts.
Restraint: High Initial Cost of LEVs Compared to Traditional Gasoline-Powered Vehicles
- Although LEVs offer long-term operational savings, the high initial cost acts as a major constraint to market growth, as price-sensitive consumers are hesitant to purchase them. For instance, electric two-wheelers may cost upwards of 30-50% more than gasoline two-wheelers, as per by the International Energy Agency.
- Similarly, U.S. Department of Energy also highlighting battery costs contributing up to 40% of LEV price and are still the main consideration! Infrastructure gaps also aggravate cost concerns, as consumers pay additional costs for home or public charging. Furthermore, industry organizations such as the Electric Drive Transportation Association note the slow rate of price parity, which would delay future adoption of LEVs despite increased government incentives.
Opportunity: Increasing Investments in Charging Infrastructure Development
- The growing investments in charging infrastructure are playing a pivotal role in furthering the LEVs market. In the U.S. alone, the number of public EV chargers has increased by more than twofold since the commencement of the Biden-Harris Administration, with more than 192,000 active chargers, adding nearly 1,000 new public chargers weekly.
- Likewise, in India, the government has been forwarding the growth of EVs with initiatives such as FAME II scheme offering investment of up to INR 1,000 crore to support the establishment of charging infrastructure with a view to electrifying 70% of commercial vehicles and 80% of two- and three-wheelers by 2030. Such strategic funding helps reinforce consumer confidence while enhancing private sector participation, thus creating the depending and growing ecosystem for LEV market growth.
Key Trend: Increasing Adoption of Subscription-Based and Leasing Models for LEVs
- The adoption of subscription and leasing models by manufacturers and dealers have scaled up the strategic innovations for presenting novel method to bring LEVs to a larger consumer base and to reduce the normally very extensive upfront financial burden of ownership.
- Microlino Lite, for example, has started placing an option for leasing, which further emphasizes the advantages of subscription model. Leasing vehicle starts at CHF149, which is about €156 or $169 per month. It broadens access for consumers when it becomes cheaper and easier to experience the microcars without all the long-term commitment of ownership.
This trend is indicative of a broader trend toward flexible, user-oriented mobility solutions intended for today's urban living.
Light Electric Vehicles (LEVs) Market Analysis and Segmental Data
The two-wheeler segment is expected to dominate the market over the forecast period, with an 82% market share in 2024.
- Two-wheelers are increasingly becoming popular means of transport in the Light Electric Vehicles market due to the low prices, the advancements in technology, and their suitability in urban region. The electric scooters (mopeds) and motorcycles provide affordable means of commuting through urban environments, corresponding to a wider consumer base that opt for cost-effective and greener alternatives.
- Exemplary instances of such progress in this niche include advances in battery technology and the introduction of battery-swapping systems, which have greatly improved performance and convenience while also providing solutions to some of consumers' most pressing concerns, such as range anxiety and charging infrastructure limitations.
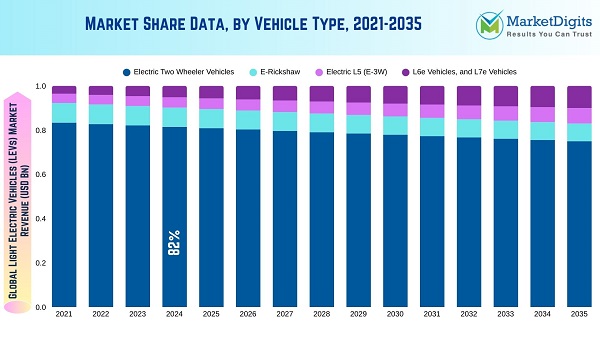
- For instance, with India leading the global two-wheeler market at nearly 18 million units sold over 910,000 of which were electric, paired with China’s 16.6 million sales, the shift towards electric two-wheelers is gaining unstoppable momentum. Together, these giants contribute over half of the global 2W market, signaling a decisive tilt toward light electric vehicles (LEVs) as the future of urban mobility.
The less than 4 kW motor capacity segment is expected to dominate the market over the forecast period, with a 64% market share in 2024.
- Growing demand for less the 4 kW motor capacity especially in 2W/3W LEVs has been reshaping the urban mobility into greener, more compact future. With urban cities tackling congestion and pollution, these compact yet efficient vehicles offer a low-cost, low-maintenance solution ideal for both commuters and businesses especially in underdeveloped regions.
- The global e-commerce (B2C) surge has further fueled this trend, with last-mile delivery needs soaring. According to the World Economic Forum, last-mile deliveries are projected to rise by 78% by 2030, positioning small-capacity LEVs as the go-to choice for affordable, efficient urban logistics. Their agility, affordability, and eco-friendliness make them requisite to the gradually developing transportation sector, solidifying their role as the backbone of sustainable last-mile delivery and green city commuting.
Asia pacific dominates the market for Light Electric Vehicles (LEVs)
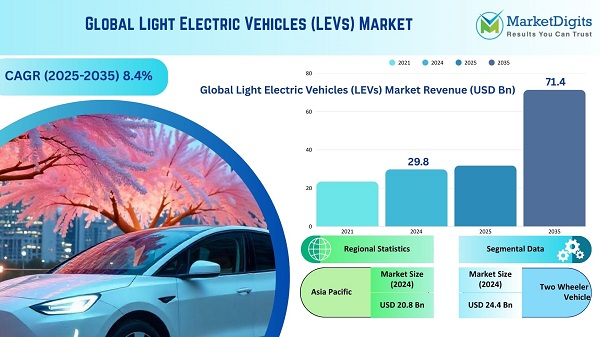
- The Asia-Pacific region has emerged as a leading market in the Light Electric Vehicles (LEVs), with a commanding 70% share in 2024 globally, primarily driven by China's unparalleled growth trajectory with market share of close to 50% in the Asia Pacific region.
- China’s electrification boom, where nearly 40% of global new car sales are electric, fuels this momentum. This growth is brought by strong government policy, heavy investment in electric mobility, and a booming domestic market. China’s aggressive innovation policies supporting start-ups and scale-up in EV manufacturing have also made Asia-Pacific the epicenter of LEV growth.

- On the contrary, Europe has steadily increased numbers of electric vehicles where in 2024 electric vehicle components make, or 16% of new sales of cars compared to less than 1% in 2019. This development indicates Europe's will to investing resources to commit to the sustainable transportation with the environment friendly development agenda.
- India is expected for significant growth in LEV market, as the world's third-largest automobile market, India's electric vehicle (EV) penetration reached 7.44% in 2024, reflecting a burgeoning shift towards sustainable mobility. Government initiatives, such as the Faster Adoption and Manufacturing of Electric Vehicles (FAME) sponsoring programs, would certainly help speed up the pace with which people adopt electric vehicles.
Light Electric Vehicles (LEVs) Market Ecosystem
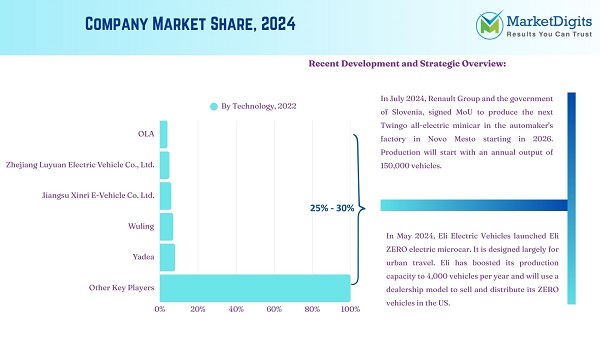
Key players operating in the LEVs Market are Ari Motors, BMW Motorrad, Carver, Citroën, Crystalyte Motors, E.Go Mobile, Geely, Gogoro Limited, Jiangsu Xinri E-Vehicle Co. Ltd., Mahindra Last Mile Mobility, Micro Mobility System AG, Ola Electric, Piaggio & C. SpA, Polaris Industries, Silence Urban Ecomobility, Squad Mobility B.V., Terra Motors Corporation, Yamaha Motor Co. Ltd., Zhejiang Luyuan Electric Vehicle Co. Ltd., and Among Others.
In addition to these manufactures, the LEV ecosystem also consists of battery manufacturers, providers of charging infrastructure, and technology companies which specialize in electric drivetrains and energy storage solutions. Collaboration among all these stakeholders is necessary to drive technology improvements in LEVs and open up the markets for them.
The light electric vehicles (LEVs) market is thus moderately fragmented owing to the diversification of consumer preferences and differing regulatory environments in the industry.
Recent Development and Strategic Overview:
- In October 2024, Kinetic Green Energy and Power Solutions Limited, India's premier e2W and e3W manufacturer launched a limited edition of Safar Smart passenger vehicle available in both lead acid and lithium battery variants. Designed for customers who require dual functionality, it offers space for both passengers and cargo. It features a hard top roof with a dedicated carrier, allowing passengers to travel comfortably while securely storing their goods on top.
Frequently Asked Questions
How big was the global light electric vehicle (LEV) market in 2024?
The global Light electric vehicle (LEV) market was valued at USD 29.8 Bn in 2024.
How much growth is the light electric vehicle (LEV) market industry expecting during the forecast period?
The global Light electric vehicle (LEV) market industry is expected to grow at a CAGR of 8.4% from 2025 to 2035.
What are the key factors driving the demand for light electric vehicle (LEV) market?
Rising Demand for Miniaturization and High-Performance Electronic Devices in Consumer Electronics as well as Growing Demand for Power-Efficient and High-Density Semiconductor Solutions in Industrial and IoT Applications.
Which segment contributed to the largest share of the light electric vehicle (LEV) market business in 2024?
In terms of vehicle category, the two-wheeler segment accounted for the major share in 2024.
Which region is more attractive for light electric vehicle (LEV) market vendors?
Asia Pacific is a more attractive region for vendors.
Who are the prominent players in the light electric vehicle (LEV) market?
Ari Motors, BMW Motorrad, Carver, Citroën, Crystalyte Motors, E.Go Mobile, Geely, Gogoro Limited, Jiangsu Xinri E-Vehicle Co. Ltd., Mahindra Last Mile Mobility, Micro Mobility System AG, Ola Electric, Piaggio & C. SpA, Polaris Industries, Silence Urban Ecomobility, Squad Mobility B.V., Terra Motors Corporation, Yamaha Motor Co. Ltd., Zhejiang Luyuan Electric Vehicle Co. Ltd., and others.
Who is the leader in EV battery?
CATL (Contemporary Amperex Technology Limited) is the leading manufacturer of EV batteries globally, holding a significant market share.
Is hydrogen better than EV?
While a hydrogen fuel cell vehicle is more efficient than a car with an internal combustion engine, it's not as efficient as a battery electric vehicle.
Cloud Engineering Market Size, Share & Trends Analysis, By Deployment (Public, Private, Hybrid), By Service (IaaS, PaaS, SaaS), By Workload, By Enterprise Size By End-use, By Region, And Segment Forecasts
TOC
Table of Contents
1. Executive Summary
1.1. Global Light Electric Vehicle (LEV) Market Outlook
1.1.1. Light Electric Vehicle (LEV) Market Size (Volume – Mn Units and Value - US$ Bn), and Forecasts, 2020-2035
1.1.2. Compounded Annual Growth Rate Analysis
1.1.3. Growth Opportunity Analysis
1.1.4. Segmental Share Analysis
1.2. Market Analysis and Facts
1.3. Supply-Demand Analysis
1.4. Competitive Benchmarking
1.4.1. Company Share Analysis
1.4.2. Company Profile Data
1.4.3. Strategic Overview, by Key Players
1.4.4. Recent Developments, by Key Players
2. Premium Insights
2.1. Key Forecast Factors & Impact Analysis
2.2. Supplier Data
2.3. Technology Roadmap and Developments
2.4. Pricing Analysis, by Vehicle Type, by Region/ Zone
2.5. Trade Analysis (For LEVs and Components)
2.6. Component Share and Analysis for Light Electric Vehicles
2.7. Analysis and Recommendations
3. Market Overview
3.1. Market Dynamics
3.1.1. Drivers
3.1.2. Restraints
3.1.3. Opportunity
3.2. Key Trend Analysis
3.3. Regulatory Framework
3.3.1. Key Regulations, Norms, and Subsidies, by Key Countries
3.3.2. Tariffs and Standards
3.3.3. Impact Analysis of Regulations on the Market
3.4. Value Chain Analysis
3.4.1. Component/ System Suppliers
3.4.2. Light Electric Vehicle (LEV) Manufacturers
3.4.3. Dealers/ Distributors
3.4.4. End-users/ Customers
3.5. Cost Structure Analysis
3.5.1. Parameter’s Share for Cost Associated
3.5.2. COGP vs COGS
3.5.3. Profit Margin Analysis
3.6. Pricing Analysis
3.6.1. Regional Pricing Analysis
3.6.2. Segmental Pricing Trends
3.6.3. Factors Influencing Pricing
3.7. Porter’s Five Forces Analysis
3.7.1. Threat of New Entrants
3.7.2. Threat of Substitute
3.7.3. Bargaining Power of Supplier
3.7.4. Bargaining Power of Buyer
3.7.5. Degree of Competition
3.8. PESTEL Analysis
3.9. Global Light Electric Vehicle (LEV) Market Demand
3.9.1. Historical Market Size - in Volume (Mn Units) and Value (US$ Bn), 2020-2024
3.9.2. Current and Future Market Size - in Volume (Mn Units) and Value (US$ Bn), 2025–2035
3.9.2.1. Y-o-Y Growth Trends
3.9.2.2. Absolute $ Opportunity Assessment
4. Global Light Electric Vehicle (LEV) Market Analysis, by Vehicle Category
4.1. Key Segment Analysis
4.2. Light Electric Vehicle (LEV) Market Size (Volume - Mn Units and Value - US$ Bn), Analysis, and Forecasts, by Vehicle Category, 2020-2035
4.2.1. Two Wheeler Vehicles
4.2.2. E-Rickshaw (3W)
4.2.3. 3W L5 Vehicles
4.2.4. 4W L6 & L7 Vehicles (Microcar)
5. Global Electric Two Wheeler Vehicles Market Analysis (LEV)
5.1. Key Segment Analysis
5.2. Electric Two Wheeler Vehicles Market Size (Value - US$ Bn), Analysis, and Forecasts, by Vehicle Type, 2020–2035
5.2.1. Scooter/ Moped
5.2.2. Motorcycle
5.3. Electric Two Wheeler Vehicles Market Size (Value - US$ Bn), Analysis, and Forecasts, by Motor Capacity, 2020–2035
5.3.1. Less than 2 kW
5.3.2. 2.1 kW to 3 kW
5.3.3. 3.1 kW to 4.3 kW
5.3.4. More than 4.3 kW
5.4. Electric Two Wheeler Vehicles Market Size (Value - US$ Bn), Analysis, and Forecasts, by Battery Capacity, 2020–2035
5.4.1. Less than 2.2 kWh
5.4.2. 2.3 kWh to 4 kWh
5.4.3. More than 4 kWh
5.5. Electric Two Wheeler Vehicles Market Size (Value - US$ Bn), Analysis, and Forecasts, by Max Speed, 2020–2035
5.5.1. Less than 45 KMPH
5.5.2. 46 KMPH to 60 KMPH
5.5.3. 61 KMPH to 90 KMPH
5.5.4. More than 90 KMPH
5.6. Electric Two Wheeler Vehicles Market Size (Value - US$ Bn), Analysis, and Forecasts, by Range (KMs), 2020–2035
5.6.1. Less than 75 KMs
5.6.2. 76 KMs to 100 KMs
5.6.3. 101 KMs to 150 KMs
5.6.4. More than 150 KMs
5.7. Electric Two Wheeler Vehicles Market Size (Value - US$ Bn), Analysis, and Forecasts, by Pricing (USD), 2020–2035
5.7.1. Less than USD 1,000
5.7.2. USD 1,001 to USD 1,500
5.7.3. USD 1,501 to USD 2,000
5.7.4. More than USD 2,000
5.8. Electric Two Wheeler Vehicles Market Size (Value - US$ Bn), Analysis, and Forecasts, by End-use Application, 2020–2035
5.8.1. Personal Use
5.8.2. Commercial Use
5.8.2.1. Business Use (Individual)
5.8.2.2. Rental Fleets
5.8.2.3. Government Fleet
5.8.2.4. Corporate Fleet
5.8.2.5. Others
6. Global E-rickshaw Market Analysis (LEV)
6.1. Key Segment Analysis
6.2. E-rickshaw Market Size (Volume - Mn Units and Value - US$ Bn), Analysis, and Forecasts, by Vehicle Type, 2020–2035
6.2.1. Passenger E-rickshaw
6.2.1.1. D+3 Passenger
6.2.1.2. D+4 Passenger
6.2.1.3. Others
6.2.2. Cargo E-rickshaw
6.2.2.1. E-Loaders
6.2.2.2. E-Carts
6.2.2.3. Others
6.2.3. Specialized E-rickshaw
6.3. E-rickshaw Market Size (Volume - Mn Units and Value - US$ Bn), Analysis, and Forecasts, by Motor Capacity, 2020–2035
6.3.1. Less than 0.5 kW
6.3.2. 0.6 kW to 1 kW
6.3.3. 1.1 kW to 1.5 kW
6.3.4. More than 1.5 kW
6.4. E-rickshaw Market Size (Volume - Mn Units and Value - US$ Bn), Analysis, and Forecasts, by Max Speed, 2020–2035
6.4.1. Less than 25 KMPH
6.4.2. 26 KMPH to 40 KMPH
6.4.3. 41 KMPH to 55 KMPH
6.4.4. More than 55 KMPH
6.5. E-rickshaw Market Size (Volume - Mn Units and Value - US$ Bn), Analysis, and Forecasts, by GVWR (KG), 2020–2035
6.5.1. Less than 650 Kg
6.5.2. 651 Kg to 900 Kg
6.5.3. More than 900 Kg
6.6. E-rickshaw Market Size (Volume - Mn Units and Value - US$ Bn), Analysis, and Forecasts, by Range (KMs), 2020–2035
6.6.1. Less than 75 KMs
6.6.2. 76 KMs to 100 KMs
6.6.3. More than 100 KMs
6.7. E-rickshaw Market Size (Volume - Mn Units and Value - US$ Bn), Analysis, and Forecasts, by Pricing (USD), 2020–2035
6.7.1. Less than USD 2,000
6.7.2. USD 2,001 to USD 2,500
6.7.3. USD 2,501 to USD 3,000
6.7.4. More than USD 3,000
6.8. E-rickshaw Market Size (Volume - Mn Units and Value - US$ Bn), Analysis, and Forecasts, by End-use Application, 2020–2035
6.8.1. Business Use (Individual)
6.8.2. Rental Fleets
6.8.3. Government Fleet
6.8.4. Corporate Fleet
6.8.5. Others
7. Global 3W L5 Vehicles Market Analysis (LEV)
7.1. Key Segment Analysis
7.2. 3W L5 Vehicles Market Size (Volume - Mn Units and Value - US$ Bn), Analysis, and Forecasts, by Vehicle Type, 2020–2035
7.2.1. L5M – Passenger Vehicles
7.2.1.1. Small L5M
7.2.1.2. Large L5M
7.2.2. L5N – Cargo Vehicles
7.2.2.1. Pick-up Vehicle
7.2.2.2. Delivery Vehicle
7.3. 3W L5 Vehicles Market Size (Volume - Mn Units and Value - US$ Bn), Analysis, and Forecasts, by Motor Capacity, 2020–2035
7.3.1. Less than 4 kW
7.3.2. 4.1 kW to 7.5 kW
7.3.3. 7.6 kW to 10 kW
7.3.4. More than 10 kW
7.4. 3W L5 Vehicles Market Size (Volume - Mn Units and Value - US$ Bn), Analysis, and Forecasts, by Max Speed, 2020–2035
7.4.1. 25 KMPH to 40 KMPH
7.4.2. 41 KMPH to 50 KMPH
7.4.3. More than 50 KMPH
7.5. 3W L5 Vehicles Market Size (Volume - Mn Units and Value - US$ Bn), Analysis, and Forecasts, by GVWR (KG), 2020–2035
7.5.1. Less than 750 Kg
7.5.2. 750 Kg to 900 Kg
7.5.3. More than 900 Kg
7.6. 3W L5 Vehicles Market Size (Volume - Mn Units and Value - US$ Bn), Analysis, and Forecasts, by Range (KMs), 2020–2035
7.6.1. Less than 100 Kms
7.6.2. 100 Kms to 150 Kms
7.6.3. More than 150 Kms
7.7. 3W L5 Vehicles Market Size (Volume - Mn Units and Value - US$ Bn), Analysis, and Forecasts, by Pricing (USD), 2020–2035
7.7.1. Less than USD 3,000
7.7.2. USD 3,001 to USD 3,500
7.7.3. USD 3,501 to USD 4,000
7.7.4. More than USD 4,000
7.8. 3W L5 Vehicles Market Size (Volume - Mn Units and Value - US$ Bn), Analysis, and Forecasts, by End-use Application, 2020–2035
7.8.1. Business Use (Individual)
7.8.2. Rental Fleets
7.8.3. Government Fleet
7.8.4. Corporate Fleet
7.8.5. Others
8. Global 4W L6 & L7 Vehicles (Microcar) Market Analysis (LEV)
8.1. Key Segment Analysis
8.2. 4W L6 & L7 Vehicles (Microcar) Market Size (Value - US$ Bn), Analysis, and Forecasts, by Vehicle Type, 2020–2035
8.2.1. By Vehicle Type
8.2.2. L6 Vehicles
8.2.3. L7 Vehicles
8.2.4. L7M – Passenger Vehicles
8.2.5. L7N – Cargo Vehicles
8.3. 4W L6 & L7 Vehicles (Microcar) Market Size (Value - US$ Bn), Analysis, and Forecasts, by Motor Capacity , 2020–2035
8.3.1. Less than 1.5 kW
8.3.2. 1.6 kW to 4 kW
8.3.3. 4.1 kW to 7.5 kW
8.3.4. 7.6 kW to 10 kW
8.3.5. 10.1 kW to 15 kW
8.4. 4W L6 & L7 Vehicles (Microcar) Market Size (Value - US$ Bn), Analysis, and Forecasts, by Max Speed, 2020–2035
8.4.1. Less than 25 KMPH
8.4.2. 26 KMPH to 45 KMPH
8.4.3. 46 KMPH to 70 KMPH
8.5. 4W L6 & L7 Vehicles (Microcar) Market Size (Value - US$ Bn), Analysis, and Forecasts, by Kerb Weight, 2020–2035
8.5.1. Less than 300 Kg
8.5.2. 301 Kg to 450 Kg
8.5.3. 451 Kg to 550 Kg
8.6. 4W L6 & L7 Vehicles (Microcar) Market Size (Value - US$ Bn), Analysis, and Forecasts, by Range (KMs), 2020–2035
8.6.1. Less than 100 Kms
8.6.2. 100 Kms to 150 Kms
8.6.3. More than 150 Kms
8.7. 4W L6 & L7 Vehicles (Microcar) Market Size (Value - US$ Bn), Analysis, and Forecasts, by Pricing (USD), 2020–2035
8.7.1. Less than USD 2,500
8.7.2. USD 2,501 to USD 3,000
8.7.3. USD 3,001 to USD 3,500
8.7.4. More than USD 3,500
8.8. 4W L6 & L7 Vehicles (Microcar) Market Size (Value - US$ Bn), Analysis, and Forecasts, by End-use Application, 2020–2035
8.8.1. Personal Use
8.8.2. Commercial Use
8.8.2.1. Business Use (Individual)
8.8.2.2. Rental Fleets
8.8.2.3. Government Fleet
8.8.2.4. Corporate Fleet
8.8.2.5. Others
9. Global Light Electric Vehicle (LEV) Market Analysis and Forecasts, by Region
9.1. Key Findings
9.2. Light Electric Vehicle (LEV) Market Size (Value - US$ Mn), Analysis, and Forecasts, by Region, 2020-2035
9.2.1. North America
9.2.2. Europe
9.2.3. Asia Pacific
9.2.4. Middle East
9.2.5. Africa
9.2.6. South America
10. North America Light Electric Vehicle (LEV) Market Analysis
10.1. Key Segment Analysis
10.2. Regional Snapshot
10.3. North America Light Electric Vehicle (LEV) Market Size Volume - Mn Units and Value - US$ Bn), Analysis, and Forecasts, 2020-2035
10.3.1. Vehicle Category
10.3.2. Vehicle Type
10.3.3. Motor Capacity
10.3.4. Battery Capacity
10.3.5. Max Speed
10.3.6. GVWR (KG)/ Kerb Weight (KG)
10.3.7. Range (KMs)
10.3.8. Pricing (USD)
10.3.9. End-use Application
10.3.10. Country
10.3.10.1. USA
10.3.10.2. Canada
10.3.10.3. Mexico
10.4. USA Light Electric Vehicle (LEV) Market
10.4.1. Country Segmental Analysis
10.4.2. Vehicle Category
10.4.3. Vehicle Type
10.4.4. Motor Capacity
10.4.5. Battery Capacity
10.4.6. Max Speed
10.4.7. GVWR (KG)/ Kerb Weight (KG)
10.4.8. Range (KMs)
10.4.9. Pricing (USD)
10.4.10. End-use Application
10.5. Canada Light Electric Vehicle (LEV) Market
10.5.1. Country Segmental Analysis
10.5.2. Vehicle Category
10.5.3. Vehicle Type
10.5.4. Motor Capacity
10.5.5. Battery Capacity
10.5.6. Max Speed
10.5.7. GVWR (KG)/ Kerb Weight (KG)
10.5.8. Range (KMs)
10.5.9. Pricing (USD)
10.5.10. End-use Application
10.6. Mexico Light Electric Vehicle (LEV) Market
10.6.1. Country Segmental Analysis
10.6.2. Vehicle Category
10.6.3. Vehicle Type
10.6.4. Motor Capacity
10.6.5. Battery Capacity
10.6.6. Max Speed
10.6.7. GVWR (KG)/ Kerb Weight (KG)
10.6.8. Range (KMs)
10.6.9. Pricing (USD)
10.6.10. End-use Application
11. Europe Light Electric Vehicle (LEV) Market Analysis
11.1. Key Segment Analysis
11.2. Regional Snapshot
11.3. Europe Light Electric Vehicle (LEV) Market Size (Volume - Mn Units and Value - US$ Bn), Analysis, and Forecasts, 2020-2035
11.3.1. Vehicle Category
11.3.2. Vehicle Type
11.3.3. Motor Capacity
11.3.4. Battery Capacity
11.3.5. Max Speed
11.3.6. GVWR (KG)/ Kerb Weight (KG)
11.3.7. Range (KMs)
11.3.8. Pricing (USD)
11.3.9. End-use Application
11.3.10. Country
11.3.10.1. Germany
11.3.10.2. United Kingdom
11.3.10.3. France
11.3.10.4. Italy
11.3.10.5. Spain
11.3.10.6. Netherlands
11.3.10.7. Nordic Countries
11.3.10.8. Poland
11.3.10.9. Russia & CIS
11.3.10.10. Rest of Europe
11.4. Germany Light Electric Vehicle (LEV) Market
11.4.1. Country Segmental Analysis
11.4.2. Vehicle Category
11.4.3. Vehicle Type
11.4.4. Motor Capacity
11.4.5. Battery Capacity
11.4.6. Max Speed
11.4.7. GVWR (KG)/ Kerb Weight (KG)
11.4.8. Range (KMs)
11.4.9. Pricing (USD)
11.4.10. End-use Application
11.5. United Kingdom Light Electric Vehicle (LEV) Market
11.5.1. Country Segmental Analysis
11.5.2. Vehicle Category
11.5.3. Vehicle Type
11.5.4. Motor Capacity
11.5.5. Battery Capacity
11.5.6. Max Speed
11.5.7. GVWR (KG)/ Kerb Weight (KG)
11.5.8. Range (KMs)
11.5.9. Pricing (USD)
11.5.10. End-use Application
11.6. France Light Electric Vehicle (LEV) Market
11.6.1. Country Segmental Analysis
11.6.2. Vehicle Category
11.6.3. Vehicle Type
11.6.4. Motor Capacity
11.6.5. Battery Capacity
11.6.6. Max Speed
11.6.7. GVWR (KG)/ Kerb Weight (KG)
11.6.8. Range (KMs)
11.6.9. Pricing (USD)
11.6.10. End-use Application
11.7. Italy Light Electric Vehicle (LEV) Market
11.7.1. Country Segmental Analysis
11.7.2. Vehicle Category
11.7.3. Vehicle Type
11.7.4. Motor Capacity
11.7.5. Battery Capacity
11.7.6. Max Speed
11.7.7. GVWR (KG)/ Kerb Weight (KG)
11.7.8. Range (KMs)
11.7.9. Pricing (USD)
11.7.10. End-use Application
11.8. Spain Light Electric Vehicle (LEV) Market
11.8.1. Country Segmental Analysis
11.8.2. Vehicle Category
11.8.3. Vehicle Type
11.8.4. Motor Capacity
11.8.5. Battery Capacity
11.8.6. Max Speed
11.8.7.
Table and Figures
Methodology:
At MarketDigits, we take immense pride in our 360° Research Methodology, which serves as the cornerstone of our research process. It represents a rigorous and comprehensive approach that goes beyond traditional methods to provide a holistic understanding of industry dynamics.
This methodology is built upon the integration of all seven research methodologies developed by MarketDigits, a renowned global research and consulting firm. By leveraging the collective strength of these methodologies, we are able to deliver a 360° view of the challenges, trends, and issues impacting your industry.
The first step of our 360° Research Methodology™ involves conducting extensive primary research, which involves gathering first-hand information through interviews, surveys, and interactions with industry experts, key stakeholders, and market participants. This approach enables us to gather valuable insights and perspectives directly from the source.
Secondary research is another crucial component of our methodology. It involves a deep dive into various data sources, including industry reports, market databases, scholarly articles, and regulatory documents. This helps us gather a wide range of information, validate findings, and provide a comprehensive understanding of the industry landscape.
Furthermore, our methodology incorporates technology-based research techniques, such as data mining, text analytics, and predictive modelling, to uncover hidden patterns, correlations, and trends within the data. This data-driven approach enhances the accuracy and reliability of our analysis, enabling us to make informed and actionable recommendations.
In addition, our analysts bring their industry expertise and domain knowledge to bear on the research process. Their deep understanding of market dynamics, emerging trends, and future prospects allows for insightful interpretation of the data and identification of strategic opportunities.
To ensure the highest level of quality and reliability, our research process undergoes rigorous validation and verification. This includes cross-referencing and triangulation of data from multiple sources, as well as peer reviews and expert consultations.
The result of our 360° Research Methodology is a comprehensive and robust research report that empowers you to make well-informed business decisions. It provides a panoramic view of the industry landscape, helping you navigate challenges, seize opportunities, and stay ahead of the competition.
In summary, our 360° Research Methodology is designed to provide you with a deep understanding of your industry by integrating various research techniques, industry expertise, and data-driven analysis. It ensures that every business decision you make is based on a well-triangulated and comprehensive research experience.
• Product Planning Strategy
• New Product Stratergy
• Expanded Research Scope
• Comprehensive Research
• Strategic Consulting
• Provocative and pragmatic
• Accelerate Revenue & Growth
• Evaluate the competitive landscape
• Optimize your partner network
• Analyzing industries
• Mapping trends
• Strategizing growth
• Implementing plans

Covered Key Topics
Growth Opportunities
Market Growth Drivers
Leading Market Players
Company Market Share
Market Size and Growth Rate
Market Trend and Technological
Research Assistance
We will be happy to help you find what you need. Please call us or write to us:
+1 510-730-3200 (USA Number)
Email: sales@marketdigits.com